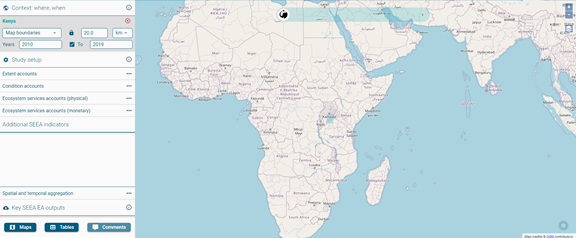
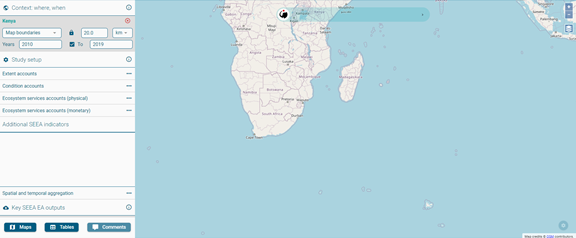
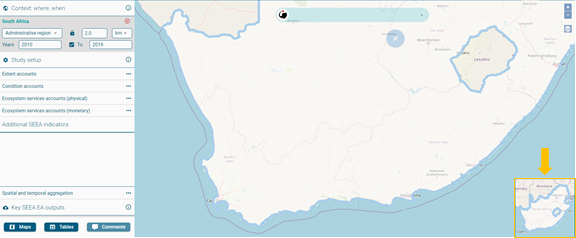
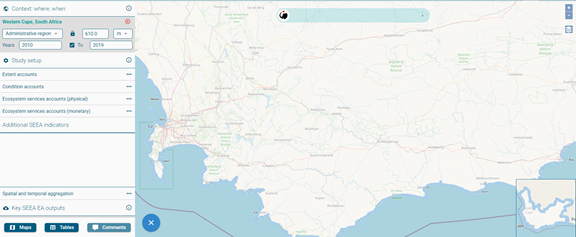
Other tips to navigate more easily the features of the application. This images are taken form the ARIES for SEEA guide, but they present features of the k.Explorer, which is independent of the application that is being used.
So the same tips provided here, are valid for the ARIES for People-EA application
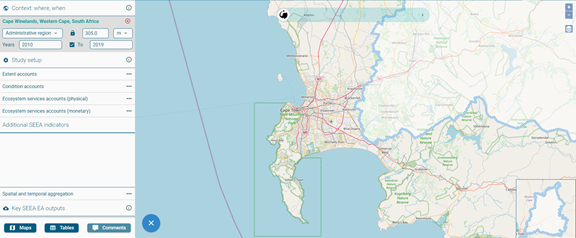
- Set your context (e.g., Cape Town in South Africa). Suggested way:
- Zoom and pan using the Map boundaries option:
- Make sure the screen contains your target context:
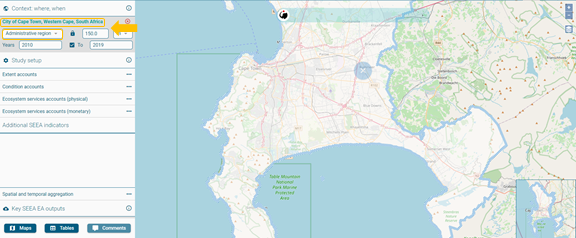
- Once the screen contains the area of interest, switch to Administrative region:
- If the whole administrative region does not fit the screen, a locator map in the lower-right corner of the interface
will show the entire context as currently selected: - Refine your search further (zooming in/out) to make sure the desired region is selected.
- Note: the region automatically selected is not always the most central, but part of the screen occupying the largest area:
- The name of the geographic entity is displayed on the upper left side of the application.
- Zoom and pan using the Map boundaries option:
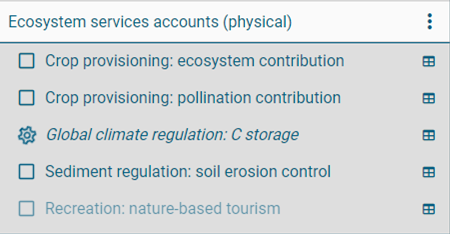
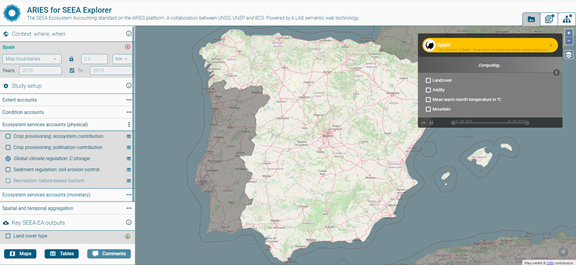
- When the gear starts spinning, the system is computing the model(s) requested by the user:
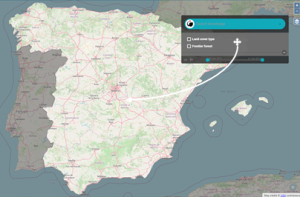
- To offer the best visualization of the context in analysis, the search bar/results box can be positioned where the user prefers.
To do so, point the cursor over the search bar, and once this symbol appears, drag it to a preferred location.
Explore results and methods used to run your accounting models
Aspects of the user interface change once you begin to run an accounting model:
- Run an accounting model (e.g., ecosystem extent account - simple net balance).
- Once the extent account is selected, the search bar will turn yellow.
A rotating gear will appear next to the selected account(s), which indicates that the model is being compiled.
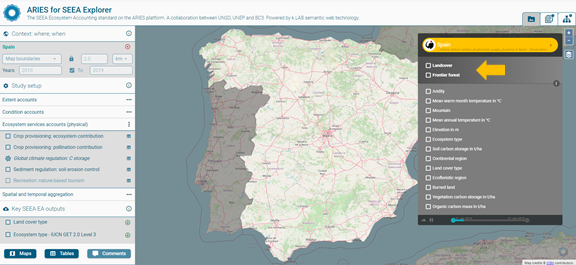
When a model input or intermediate output has been computed, it is listed and can be explored individually, by selecting the specific layer (e.g., aridity): - When a main output of the model is computed, this is listed (in the darker section) above the other inputs/intermediate output:
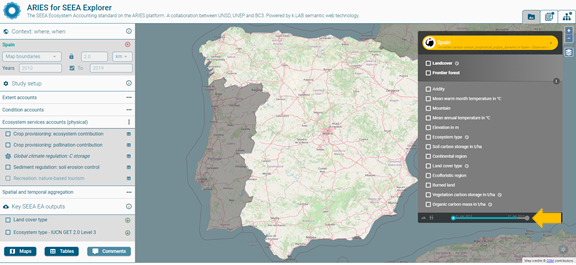
- If the model is dynamic (i.e., is calculated for >1 year), the progress bar at the bottom of the search bar/results box progresses as the computation continues:
- In the right-upper corner of the app, three tabs are now available:
- Data view (always available)
- Documentation view
- Data flow view
- In our example, the application automatically takes the user to the section showing the accounting result(s).
This happens every time a final outcome is generated: - To review other sections of the documentation:
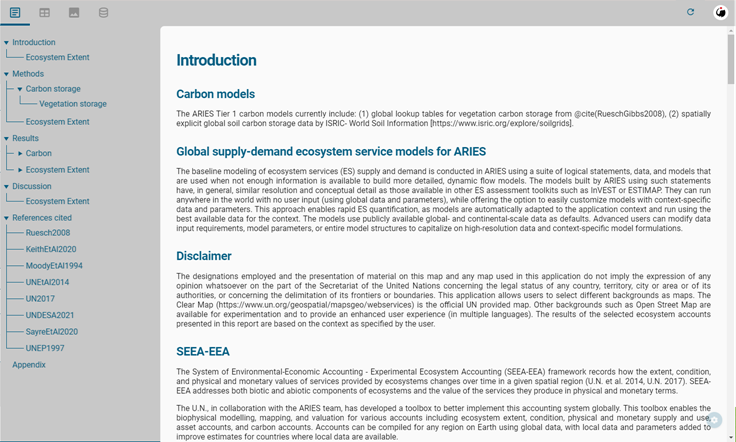
- The report
- The tree menu on the left facilitates navigation. Each report includes:
- A general introduction to the model(s);
- Information on the SEEA framework or any other more general modeling frameworks (when part of a larger set of models);
- The methods applied;
- A summary of the main results;
- Caveats or other considerations in interpreting model results, as part of the discussion; and
- Reference(s) for data and method(s) used.
- Once the extent account is selected, the search bar will turn yellow.
- Run an accounting model (e.g., ecosystem extent account - simple net balance).
Tabular results
To ease the observation of the results:- The first column is visible while scrolling to the right,
- Results can be sorted by the element in the first column, or by ascending and descending order of the result of any column,
- Text size can be adjusted using the buttons in the upper right (with yellow circles).
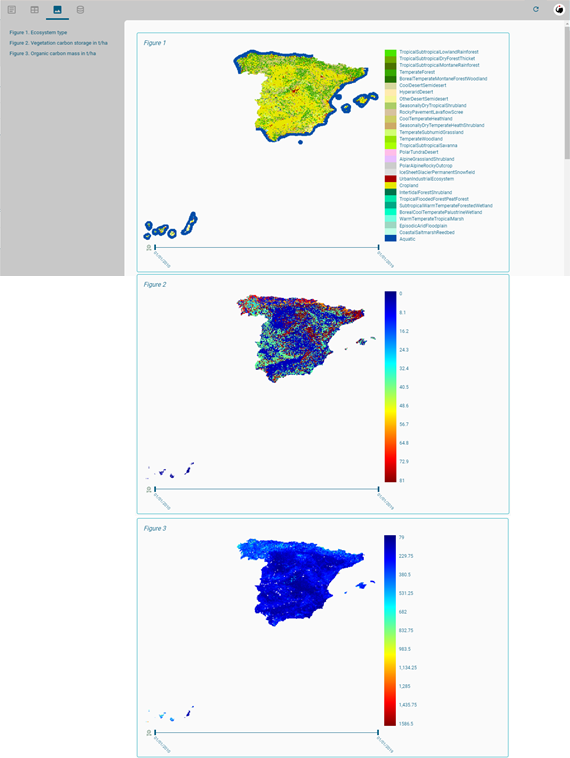
Image(s) section
Figure(s) and (maps) generated during the computation are listed in this section and can be explored individually.
If results come from multi-year models, the maps are interactive and show changes over time.Resources section
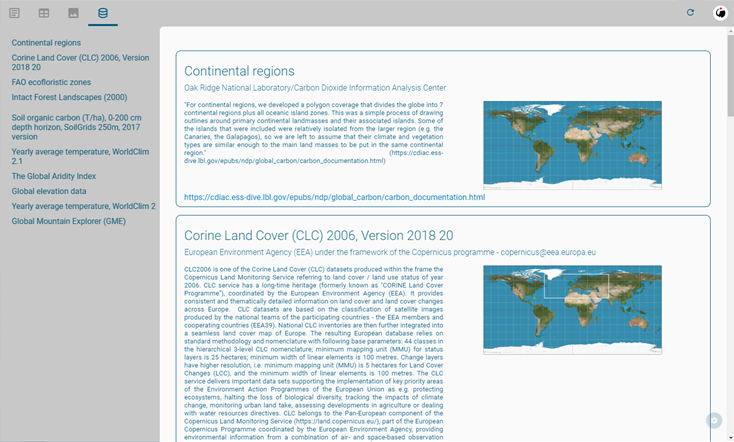
Lists all the resources used in the computations, to provide full-transparency on the final output.
Each of the data resource can be explored individually- Dataflow section: shows a list containing a visual summary of each model component and how these were combined to obtain the final results. In the next version of ARIES for SEEA, this section will also report the decisions taken by the system on:
- Which combination of data and models was implemented,
- Which data and model alternatives could have been used instead and,
- The AI parameters used to support the choices made.
The third tab available once a model has run is the Dataflow view
This shows a diagram that visually summarize each model component and how those were combined to obtain the final result(s). Clicking on an individual rectangle provides details about the dataset, algorithm, etc. used at each step of the model.
Other ARIES features
While most of the functions needed to compile SEEA accounts are available through ARIES for SEEA interface, the normal functionalities of the ARIES Explorer remain available through the search bar.
This sections shows how to query them.
Search the knowledge bar (1)
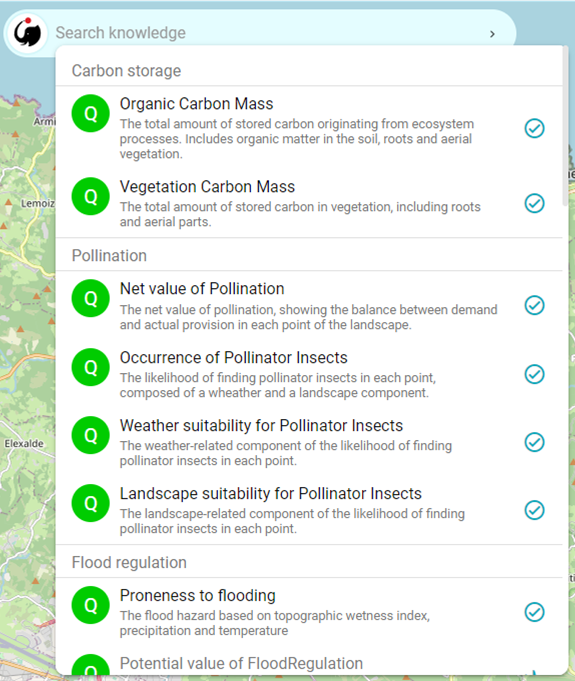
This box is used to call models, select your context, modify default settings, and show the help page.Query an observable from the space bar (A):
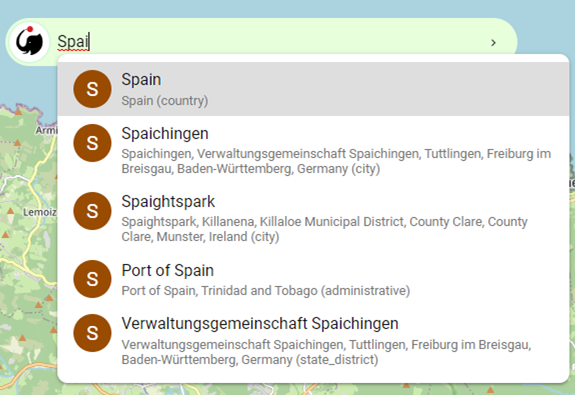
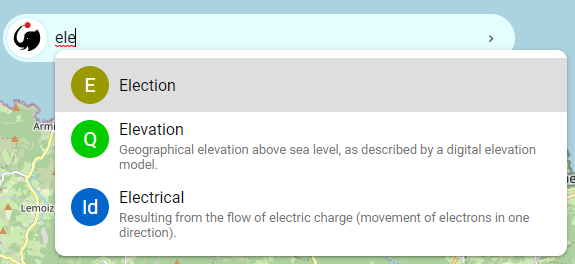
Please note: unlike the search bar in the ARIES for SEEA application, the general ARIES Explorer search bar is case-sensitive.- Press the space bar on the empty box to receive suggestions.
- Start with an upper-case letter to search for a geographical context (invalid if you have already set a context).
- Start with a lower-case letter to search for an observation (e.g., elevation),
Option (iii) enables users to compute a model available in the ARIES Explorer environment and appropriate for the SEEA framework, but which is not contained as an option in the application.
This option can be used to explore a wide range of different models (termed observables), which can refer to model inputs or outputs.
- Press the space bar on the empty box to receive suggestions.
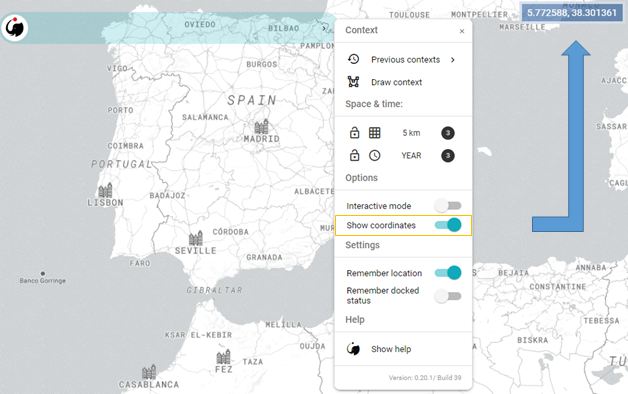
- Other settings/options/help (B)
-
Context:
- Reset a previously used context
- Draw a new context (using your cursor)
- Space and time:
- Adjust the spatial and/or temporal resolution of your analysis
- Options
- Activate the interactive mode to add manually add input to the model (adjusting parameter values)
- Settings
- Remember location (remember the last context selected)
- Remember docked status
- Help
- Show the help tutorial
- Show the help tutorial
- New option to show the coordinates of your cursor (they change as you move it around)
Zoom (2)
Zoom in (by clicking on the
) and out (
). This can be useful when selecting your context using map boundaries (entire rectangle shown in the interface) or administrative regions or river basins, which change as a user zooms and pans the map.
Background map (3)
Select the background map you prefer. By default, ARIES uses OpenStreetMap as it currently offers the best user experience even at higher resolutions.
The user can switch to other available background maps as desired.
